

Anatomy of the Forbes 400: Who’s Actually On the List
The Million Dollar Question: Of the 400 people on the 2025 Forbes 400, how many built their fortune starting from a genuinely working-class background?
A) About 180 B) About 110 C) About 49 D) About 20
Read on for the answer.
The Forbes 400 is usually read as a leaderboard — a ranking of who is winning. Read instead as a dataset, it becomes something more useful: a portrait of how extreme wealth in America is actually structured. This piece takes the 2025 list apart along five lines — geography, industry, age, gender, and the path each person took to get there — and shows where the popular picture of the list is wrong.
What it is
The Forbes 400 is the annual ranking of the 400 richest people in America. The 2025 edition, the one this piece dissects, holds a combined $6.6 trillion in net worth — up $1.2 trillion in a single year, the largest one-year jump on record, according to Forbes’s own accounting of the list. The price of admission was a record $3.8 billion, up $500 million from the year before. Everyone on the list is a billionaire several times over; the poorest member would have topped the list outright two generations ago.
At the top sit the names everyone knows: Elon Musk at roughly $428 billion — the first person ever measured past $400 billion, then Larry Ellison around $276 billion and Mark Zuckerberg around $253 billion. Those three figures are why the list gets written about the way it does — as a story about a handful of founders.
But a list of 400 people contains 397 names that aren’t Musk, Ellison, or Zuckerberg, and the shape of those 397 is where the interesting questions live. Who are they? Where do they live? How did they get there? The rest of this piece answers those questions with the numbers, not the anecdotes — and you can explore every one of these breakdowns yourself in the interactive Forbes 400 dashboard. (For the separate question of how Forbes arrives at any of these dollar figures — and why the lists disagree with each other — see the companion piece, Billionaire Rankings: How Extreme Wealth Is Counted.)
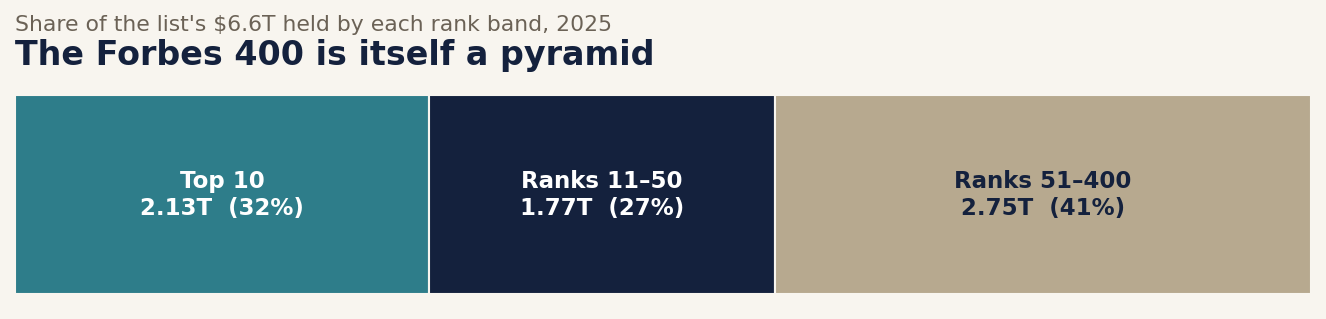
The single most important fact about the list’s shape is in that chart. The top 10 names alone hold about $2.13 trillion — 32% of the entire list’s wealth. The average member is worth $16.6 billion, but the median is just $7.5 billion; the gap between those two numbers is the handful at the top dragging the average upward. The Forbes 400 is not a flat club of comparably rich people. It is a pyramid with a very sharp point.
Who’s on it
Start with the simplest demographic facts, because they cut against the popular image immediately.
The list is overwhelmingly male: 332 men to 68 women, so women are 17% of the names. It is also old. The average age is 70, and the age distribution leans heavily toward the back half of life.
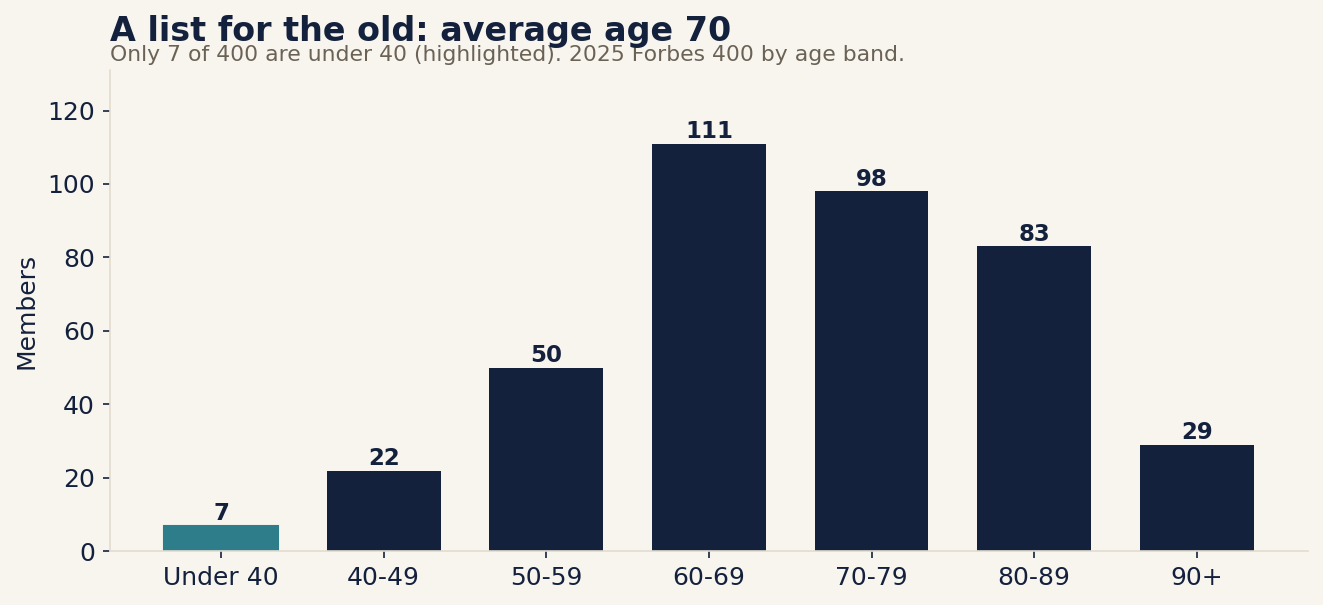
Only seven members are under 40. The largest single age band is the 60s, with 111 people, followed by the 70s and 80s. There are more members over 90 (29 of them) than under 40. Great fortunes, even in the founder era, take decades to build or generations to inherit — and the list reflects that. The youthful tech-billionaire archetype is real but rare; it is the exception the headlines select for, not the center of mass.
The exceptions are worth naming because they’re genuinely new. In 2025, 14 people made the Forbes 400 for the first time, worth a combined $113.3 billion. The wealthiest newcomer was Edwin Chen, 37, who founded the data-labeling company Surge AI in 2020 and built it past $1 billion in annual revenue in five years with no outside investors — a roughly $18 billion fortune that didn’t exist at the start of the decade. That kind of entry is what people picture when they think of the list. It is also, statistically, the rare case.
Where they live
Extreme American wealth is not spread across the country. It clusters, and it clusters hard.
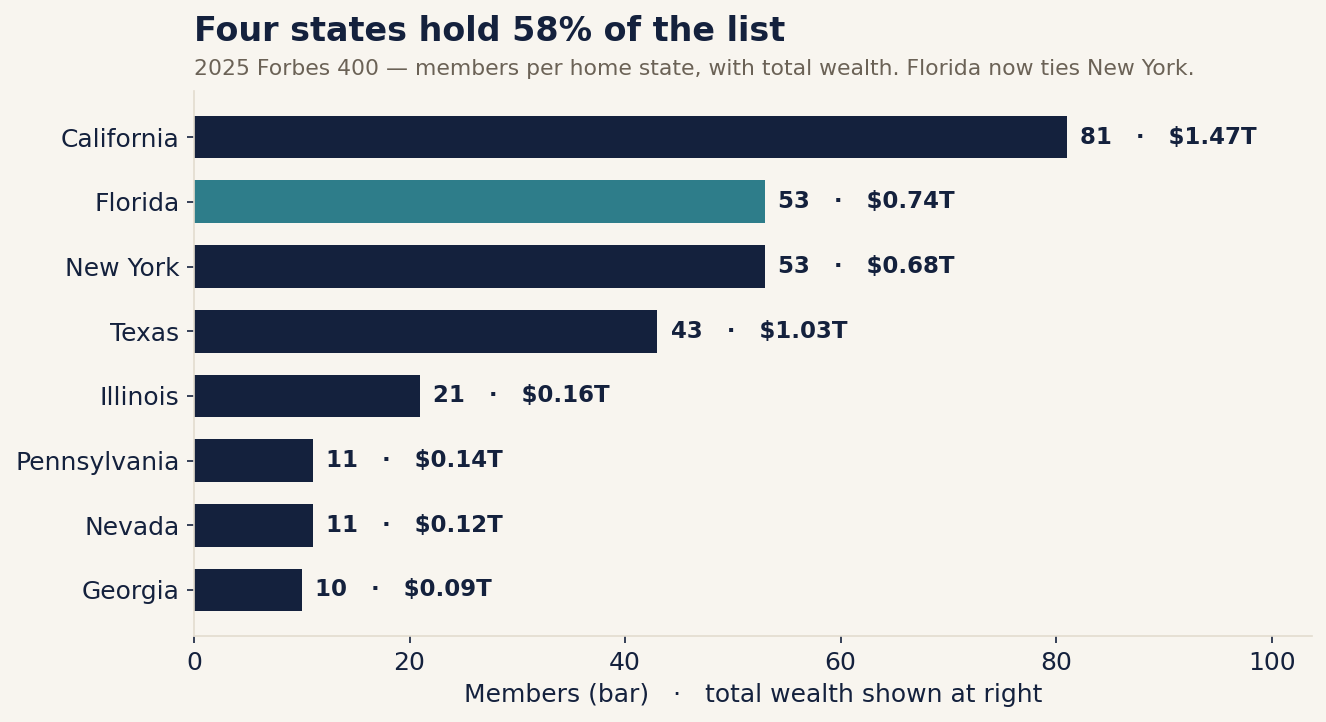
Four states hold 230 of the 400 members — 58% of the list. California leads decisively with 81. Then comes the headline shift: Florida, with 53 members, is now tied with New York at 53. Texas follows at 43, then Illinois at 21. The old assumption that New York is the natural home of American money is no longer quite true by headcount; Florida has caught it, and the gap between them and the next tier of states is wide. The reversal is recent and real: on the first Forbes 400 in 1982, New York led the country with 77 members to California’s 48. Four decades later California has pulled well ahead, and the Sun Belt — Florida and Texas — has drawn level with or passed New York.
By wealth rather than headcount, the ranking reshuffles again. California still leads at about $1.47 trillion, but Texas is second at roughly $1.03 trillion — ahead of both Florida ($0.74T) and New York ($0.68T) — despite Texas having fewer members than New York. A smaller number of very large Texas fortunes outweighs New York’s larger number of smaller ones. The migration of wealth toward Florida and Texas, and away from the traditional coastal centers, is one of the defining wealth stories of the decade; it’s treated directly in Billionaires Flood Miami: Wealth Migration and the New American Geography and sits underneath the rankings in ZIP Codes: Where the Wealthy Live.
How they made it
Ask which industry produces the most billionaires and the answer is finance. Ask which industry holds the most billionaire wealth and the answer is technology. Both are true at once, and the gap between them is the story.
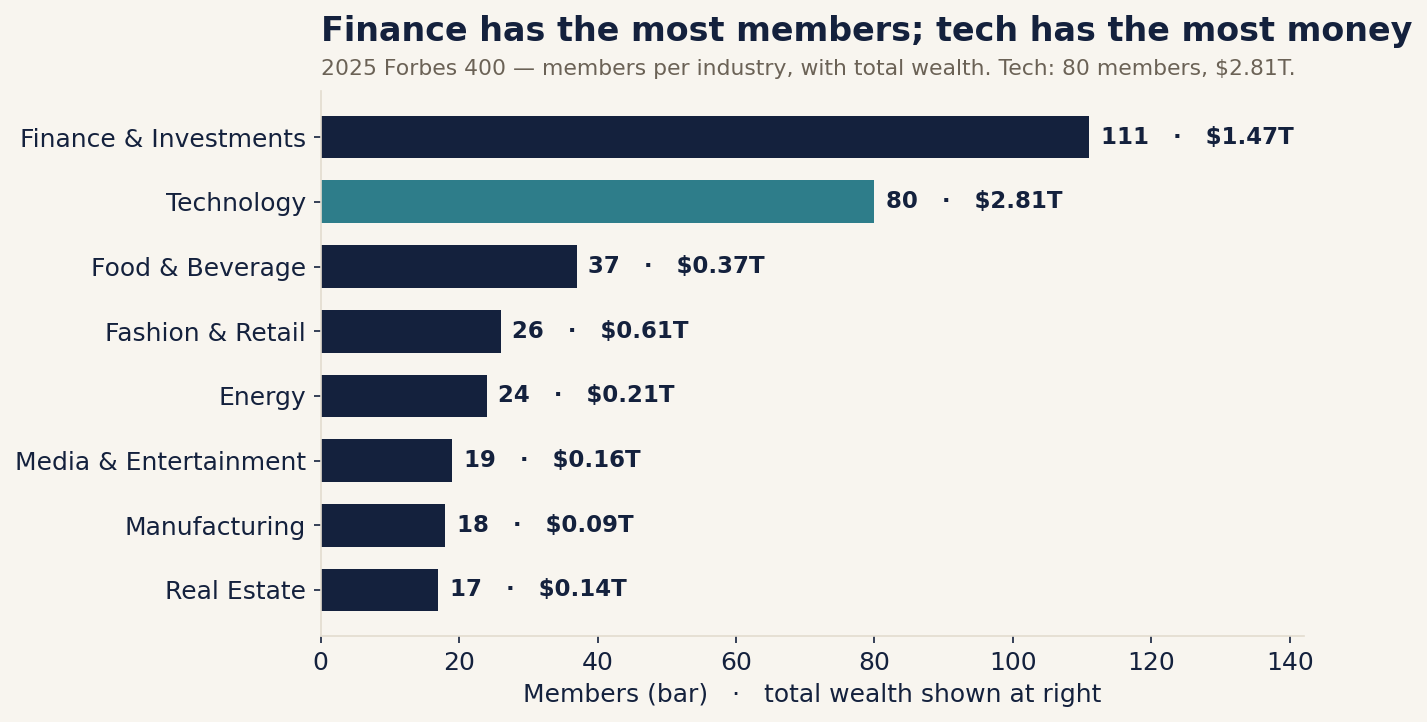
Finance & Investments is the most common path onto the list, with 111 members — hedge fund managers, private-equity founders, asset managers, value investors. But those 111 people hold about $1.47 trillion. Technology has only 80 members, yet holds $2.81 trillion — nearly double the wealth with 31 fewer people. After those two, the drop is steep: Food & Beverage (37 members), Fashion & Retail (26), and Energy (24) round out the upper tier, but none approaches the top two in either count or dollars.
The lesson is that finance is the reliable road to great wealth and technology is the steep one. Finance produces billionaires in volume; technology produces the handful of nine- and ten-figure fortunes that sit at the very top of the pyramid from the first chart. The names in the top 10 are overwhelmingly tech equity, not finance — which is why the list’s center of gravity (finance, by bodies) and its peak (tech, by dollars) point in different directions. The shift is historically enormous: on the 1982 list, technology fortunes were about 3% of the names and oil was 22.8%. In four decades technology has gone from a rounding error to the single largest store of wealth on the list, while oil has receded into the broader energy tier. The cultural texture of the tech-wealth path — founder norms, equity over salary, the optimization mindset — gets its own treatment in Tech Wealth: How Founders and Investors Live Differently.
Self-made vs. inherited
This is the section the Million Dollar Question points at, and it’s where the popular story about the list is most misleading.
Forbes describes the list as increasingly self-made, and by the simplest binary that’s true. Since 2014 Forbes has scored every member on a self-made scale from 1 to 10 — 1 for an inherited fortune the heir hasn’t grown, 10 for someone who grew up poor and overcame significant obstacles — and treats a score of 6 or above as “self-made”. On the 2025 list, 263 of the 400 clear that bar (66%) and 137 do not — about two-thirds to one-third. If “self-made” meant “rose from nothing,” that would be a remarkable statistic about American mobility.
It doesn’t mean that. The 6-or-above cutoff only means the person did not simply inherit their fortune — it says nothing about the floor they started from. A founder who grew up comfortably middle-class and a founder who grew up poor both clear the bar. When you sort the list by the background each member actually came from — using the finer grain inside Forbes’s own 1-to-10 score — the picture changes completely.
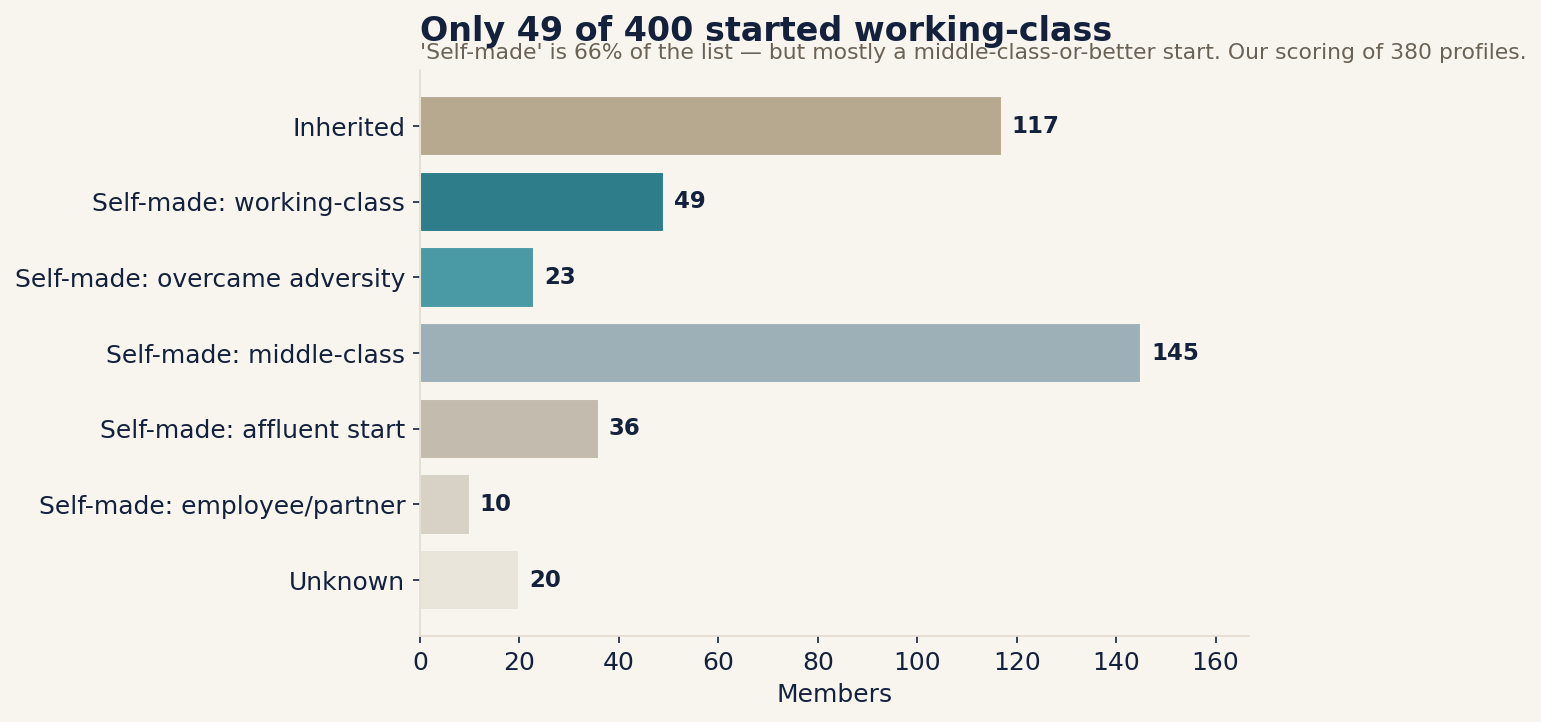
Only 49 members — about 12% of the entire list — are scored as building their fortune from a genuinely working-class background. That’s the answer to the Million Dollar Question: C, about 49. The largest self-made group by far started from a middle-class background (145 people). Another 36 started from outright affluence — already-wealthy families whose children went on to build separate fortunes of their own, which counts as self-made but is not the rags-to-riches image the word conjures. And 10 made their money as early employees or partners rather than founders.
There is one honest complication worth surfacing, because the answer is “bait, not a gotcha.” A further 23 members carry the top self-made score of 10 — the ones who didn’t just start working-class but grew up poor and overcame serious obstacles. Counted with the 49, that puts the number who came from genuinely modest beginnings at roughly 72 — still under one in five of the entire list. So the working-class-specific bucket is 49; the broadest possible “started with little” reading is about 72. Either way, the headline holds: somewhere between one in eight and one in five of the Forbes 400 came up from modest roots. The rest either inherited, or started from a middle-class-or-better position that, while not a handed-down fortune, was a real head start — education, networks, capital, and the freedom to take risks.
That’s not just our read. The Institute for Policy Studies has argued that “over 60 percent” of the Forbes 400 “grew up in substantial privilege”, noting that wealthy parents pass on advantages — tuition, connections, a safety net — that never show up as a line-item inheritance. “Self-made” on the Forbes 400 almost never means working-class. It means a head start that paid off.
A note on method, because it matters for honesty: the underlying 1-to-10 self-made score is Forbes’s own field. The named tiers in the chart — inherited, working-class, middle-class, affluent, overcame adversity, employee/partner — are our grouping of those scores into plain-language buckets, not labels Forbes publishes. The mapping is mechanical (each Forbes score becomes one tier), so the counts are as defensible as Forbes’s scoring itself; what’s “ours” is the naming, not the judgment. Twenty members carry no published self-made score and sit in an “unknown” tier — which is why the 137 who fall short of self-made break down as 117 scored heirs plus 20 unclassified, rather than 137 confirmed heirs.
The myth that great wealth typically starts from nothing — and the related social-media claim that it comes from juggling seven income streams — gets a fuller autopsy in Multiple Streams of Income: The Myth, the Math, and What Wealthy Households Actually Do and in Paths to Millions.
The women on the list, and the concentration at the top
Two structural facts deserve their own section because they’re the ones readers find hardest to believe.
The first is about women. There are 68 women on the 2025 list, and only 14 of them are self-made. The other 54 inherited their wealth — overwhelmingly the daughters, widows, and granddaughters of family fortunes (the Walton, Mars, Cox, and Johnson names recur). So while women are 17% of the list overall, they are a far smaller share of the self-made list: the founder path to extreme wealth remains very nearly closed to women, and the women who are on the list are there mostly through family rather than founding. Whether that gap is closing is an open question. The youngest self-made woman billionaire in America is now Lucy Guo, 30, a co-founder of Scale AI — but at around $1.3 billion she sits well below the Forbes 400’s $3.8 billion cutoff, a reminder of how high the bar to this particular list has climbed. On the 2025 Forbes 400 itself, the gap has not closed.
The second is the concentration already visible in the first chart, and it bears repeating in human terms. The top 10 people hold a third of the wealth of all 400 — about $2.13 trillion. The bottom half of the list — 200 people, each worth billions — together hold roughly $1.08 trillion, around half of what the top 10 hold. The span inside the list is staggering on its own: the richest member, Elon Musk at about $428 billion, is worth roughly 113 times the $3.8 billion it took just to make the list, and nearly as much as the entire bottom hundred names of the list combined (about $453 billion). Even inside one of the most rarefied groups on earth, the distribution of wealth is wildly unequal. The Forbes 400 is not a plateau of similar fortunes; it is the same steep pyramid as the wealth distribution it sits atop, just sampled from the very top — which is the deeper reason a single list can hold $6.6 trillion and still be a study in inequality.
What people get wrong
Five corrections, drawn from the sections above.
“Self-made means up from nothing.” It almost never does. Two-thirds of the list clears Forbes’s self-made bar, but only about one in eight is scored as working-class in origin — and even counting everyone who grew up poor, the figure stays under one in five. The score measures not inheriting, not starting with nothing.
“It’s a young tech list.” The average member is 70, and only seven are under 40. Technology dominates the list’s dollars but not its bodies — finance has more members. The young tech founder is the archetype the headlines choose, not the typical member.
“Women are catching up at the top.” There are 68 women on the list and only 14 are self-made. By the founder path, the top of American wealth remains nearly all male.
“Everyone on the list is roughly comparably rich.” The top 10 hold a third of the total; the average ($16.6B) is more than double the median ($7.5B). The list is a pyramid, not a plateau.
“The Forbes 400 is a precise measurement.” It is a set of estimates, produced by journalists, that disagree with rival lists by tens of billions of dollars on the same person on the same day — and the demographic tiers in this piece are our plain-language grouping of Forbes’s own self-made scores layered on top. Read the numbers as a well-sourced portrait, not an audit. The mechanics of that uncertainty are the whole subject of Billionaire Rankings: How Extreme Wealth Is Counted.
Bottom line
The answer to the Million Dollar Question is C: about 49 of the 400 are scored as starting from a working-class background — roughly one in eight, despite two-thirds of the list clearing Forbes’s self-made bar. Count in everyone who grew up poor and the figure rises to about 72, still under one in five. That gap, between what “self-made” sounds like and what it actually measures, is the most honest summary of the list.
Taken apart, the 2025 Forbes 400 is less a story about 400 self-made winners than a portrait of how concentrated, inherited-adjacent, old, geographically clustered, and tech-topped American extreme wealth has become. Four states hold most of it. Finance supplies the bodies and tech supplies the dollars. The average member is 70 and male. The top 10 hold a third of everything. And the rags-to-riches story that the list is supposed to embody describes, at most, fewer than one in five of the people on it. The list is real, and the wealth is real — but the picture it’s usually used to paint is not the picture the data shows.
Related reading: Billionaire Rankings: How Extreme Wealth Is Counted · Wealth Levels: Life at $1M, $10M, $100M, and $1B · Billionaires Flood Miami: Wealth Migration and the New American Geography · ZIP Codes: Where the Wealthy Live · Multiple Streams of Income: The Myth, the Math, and What Wealthy Households Actually Do · The Forbes 400, 1982–2025: the data