

Part 4 of 4 in the series The Forbes 400. See every installment →
The Million Dollar Question: On the 2026 Forbes 400, which industry put the most people on the list?
Read on for the answer.
What the 2026 list actually says
How do billionaires make their money? For the richest 400 Americans, there is a published answer, and it is not the one most people would guess.
On the 2026 Forbes 400, Forbes assigns every member a sector. The counts run: finance and investments 108 members, technology 88, food and beverage 35, fashion and retail 26, energy 23, real estate 18, media and entertainment 17, sports 16, healthcare 15, manufacturing 15. Seven smaller categories hold the rest.
The answer to the Million Dollar Question is B. Finance puts more people on the list than any other sector, and has done so for most of the last twenty years. It is not close: 108 against technology’s 88.
Now run the same list by dollars rather than by heads, and the ranking inverts. Those 88 technology fortunes are worth about $3.9 trillion between them — 48% of the list’s combined $8 trillion. The 108 finance fortunes come to roughly $1.6 trillion, or 20%. Twenty more people, less than half the money.
That gap is the whole story of this post. The common account of where American fortunes come from — oil and real estate, then finance, then software — is roughly right about the sequence and badly wrong about the shape. Finance never handed off to software. It is still the most common way onto the list. What changed is that the largest individual fortunes stopped being finance fortunes, and the distance between the biggest fortune and the typical one grew enormous.
To see that properly you need more than one list. You need all of them.
How a free-text field becomes forty-four years of sectors
Forbes has only published a clean industry label for recent lists. Go back into the archive and what exists instead is a free-text field — the “source of wealth” line printed beside each name. Across this site’s Forbes 400 panel it holds 3,000 distinct strings, written by different editors over four decades: Oil, Oil, rl est (inheritance), Wal-Mart Stores, Inc., leveraged buyouts, Inheritance (Du Pont Co.), Hedge Funds, Artifical intelligence — typo included.
Turning that into a comparable series means writing a classifier: a set of ordered rules that reads each string and assigns it to one of Forbes’ seventeen current categories. Two design choices matter.
First, position, not precedence. When a string names more than one sector — “Oil, investments” — the rule that wins is whichever sector appears earliest in the text, not whichever of our rules happens to be listed first. The assumption is that Forbes’ free text usually leads with the dominant source. Both versions were built and scored, and this is the one that scores slightly worse: ordering by position agrees with Forbes’ own labels on 83.1% of rows, ordering by our rule precedence on 84.2% — nine rows out of 792. We kept position anyway, because it is a rule about the text rather than about the order we happened to write our own rules in, and the alternative is tuning a classifier to its own scoreboard.
Second, “inheritance” is not a sector. Several hundred entries say only that the money was inherited and never say from what. Those get their own category rather than being forced into a guess. That category is itself informative: it peaks at 15% of the 2000 list and disappears entirely after 2010, which almost certainly reflects a change in what Forbes recorded rather than heirs ceasing to appear.
The classifier can then be tested two ways, and both tests are worth stating because they bound how much weight the chart below will carry.
Test one: against Forbes’ own labels. For 2025 and 2026 both the free text and Forbes’ official industry field exist. Run the classifier on the text and compare. It assigns a sector to 99.9% of rows and agrees with Forbes exactly 83% of the time. The disagreements are not random — they cluster where any taxonomy would strain. Forbes files some streaming and platform fortunes under technology where the text says media; it files some operating-company owners under “diversified” where the text names one business. Roughly one row in six is a judgment call rather than a fact.
Test two: against Forbes’ own published history. In 2010 Forbes looked back at its first list and reported that the 1982 Forbes 400 was 22.8% oil fortunes, 15.3% manufacturing, 9% finance and 3% technology. Running this classifier over the nearest available universe — every 1982 row the panel holds, family groupings included — returns 23.6% energy, 13.6% manufacturing, 8.3% finance and 2.0% technology. Four categories, none off by more than 1.7 points, from an independent reconstruction of a forty-four-year-old magazine page. It is not quite like for like: Forbes’ denominator was its 400 printed entries and ours is the 398 panel rows we can classify, and Forbes’ “oil” is narrower than our “energy”, which also holds coal, mining and utilities. Close enough to trust the shape; not close enough to argue about a decimal.
So: good enough to show the shape of a four-decade migration, not good enough to argue about one point in one year. Everything below is written to that tolerance.
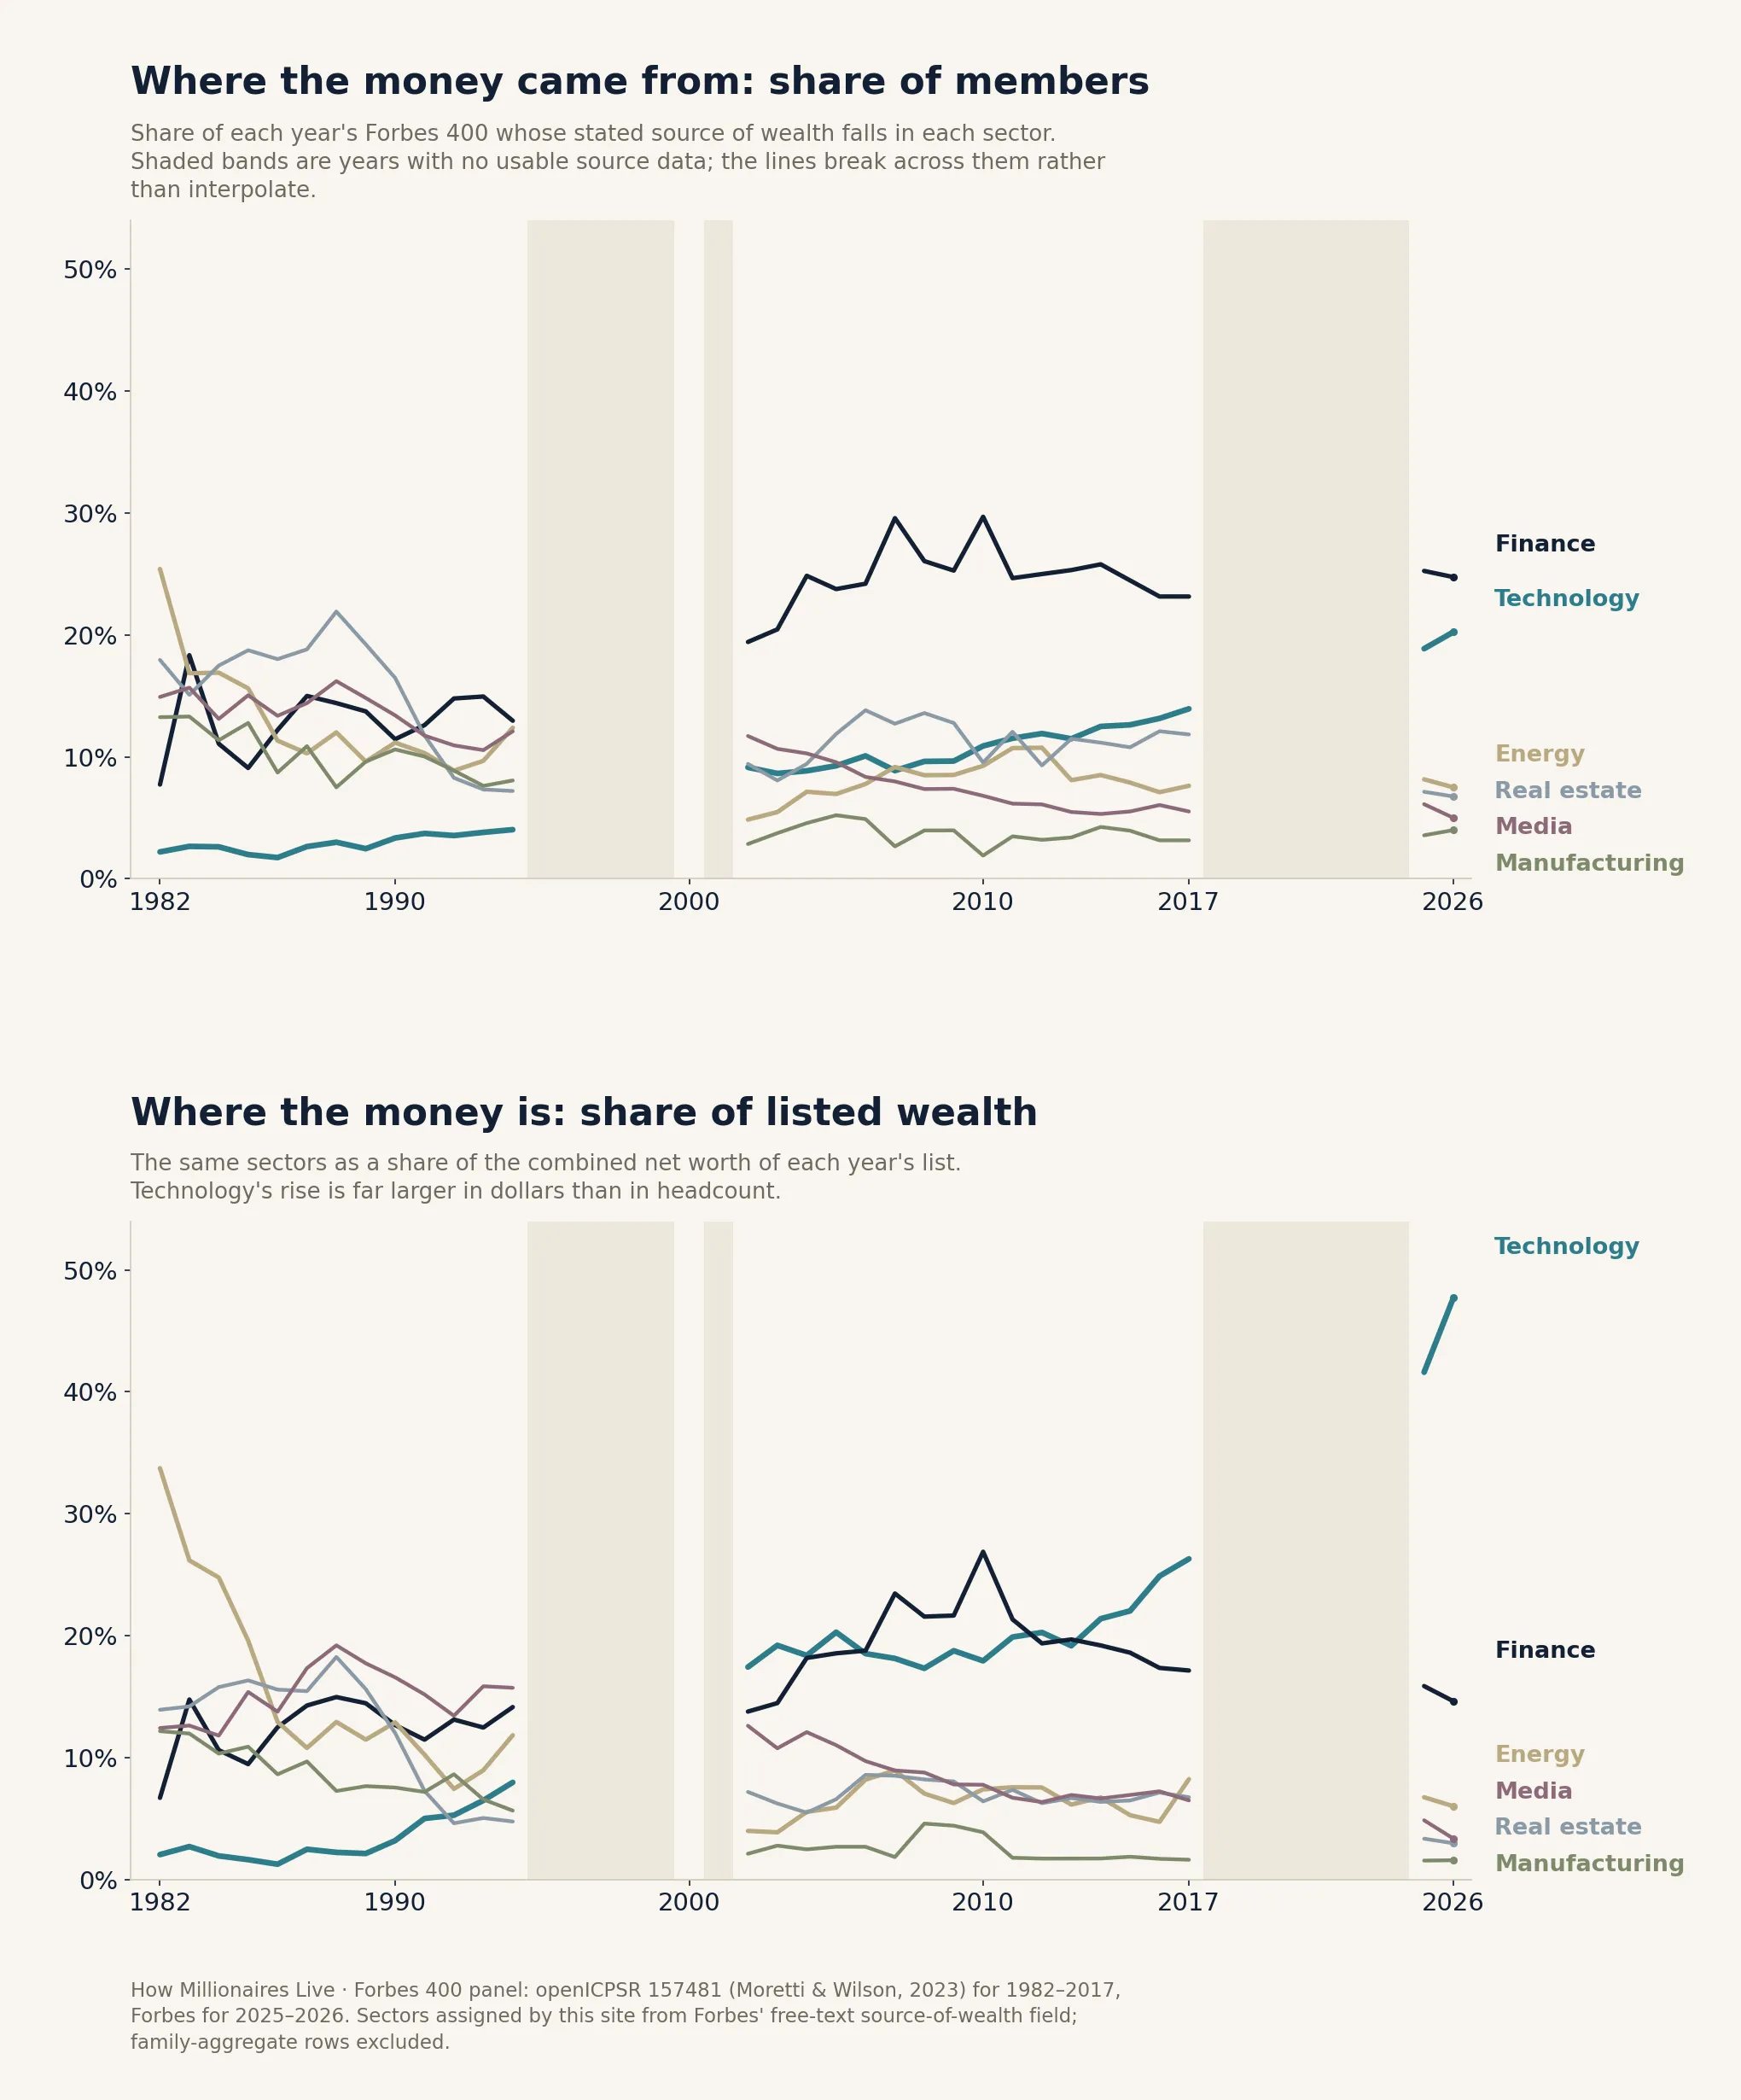
Two gaps also need declaring before any chart appears. The panel has no usable source-of-wealth text for 1995–99 or 2001, and no list at all for 2018–24, because no open person-level source covers those years. The lines break across both. An interpolated line there would draw a trend nobody measured.
1982 was an oil list
The first Forbes 400 does not look like a list of businesspeople. It looks like a map of American resource extraction with some landlords attached.
A quarter of the 1982 members — 92 of 362 classifiable individuals, or 25.4% — had made their money in oil, gas, coal or mining. Another 18% were in real estate. Media and publishing accounted for 15%, manufacturing 13%. Finance was 8%. Technology was 2%: eight people on the entire list.
In dollars the concentration was starker still. Energy fortunes held 34% of all the wealth on the 1982 list. The single largest category today — technology — held 2.0%.
The names make the point faster than the percentages. The 1982 list carried eleven entries bearing the Hunt name and more than twenty carrying the du Pont name, including heirs listed under married names. Gordon Getty was on at $1.4 billion in oil inheritance. Philip Anschutz, Marvin Davis, Perry and Sid Bass, Margaret Hunt Hill and Lamar Hunt were all oil entries. Forbes’ own 2002 retrospective put it bluntly: 13% of the 1982 list came from three families — the Hunts, the Rockefellers and the du Ponts. By 2002 that was one Hunt, three Rockefellers and no du Ponts at all.
Sports did not exist as a category. Not one of the 1982 members was listed as having made their money from a team. Healthcare was 2%. The categories that would come to define the list were either tiny or absent.
Oil’s collapse, and what filled the space
Energy’s share of the list did not erode gently. It fell off a ledge.
In 1982, 92 members were energy fortunes. By 1986 the figure was 11.4% of the list; by 1989, 9.6%. Measured by the literal word “oil” in the source field, the count went from 90 members in 1982 to 36 in 1987 and 10 by 2000.
What happened underneath it is not mysterious, though the panel itself cannot prove the link. The U.S. Energy Information Administration records the average first purchase price of U.S. crude oil at $31.77 a barrel in 1981 and $28.52 in 1982 — the year Forbes was compiling that first list. By 1986 it was $12.51. A 56% fall in four years. Reserve valuations, drilling programmes and the Texas banks that financed them all moved with that price, and so, on the evidence of the timing, did the fortunes built on them — though a price series and a membership list running in parallel is not the same thing as a demonstrated cause.
What replaced oil at the top of the list was not one thing. For most of the late 1980s and 1990s the largest single category by headcount was real estate, which peaked at 21.9% of the 1988 list. Then that fell too, from 21.9% in 1988 to 7.2% by 1994, as the commercial property crash and the savings-and-loan collapse worked through. Real estate has never again been more than about 14% of the list, and in 2026 it is 6.8%. The sector that most Americans associate with wealth is now a minor category on the list of the largest American fortunes.
Manufacturing is the quietest collapse of all, because nothing dramatic happened to it on any particular date. It was 13.3% of the 1982 list and 12.2% of its wealth. It is 4.0% and 1.6% now. A sector that once put one member in eight on the list now holds a rounding error of its money.
Finance arrives, and then stops moving
Finance is the category people usually name when asked where modern fortunes come from, and the data half agrees.
Through the 1980s finance bounced between about 8% and 18% of the list with no trend in it. Then it climbed: 15% in 2000, 19.4% in 2002, 24.9% in 2004, and a peak of 29.7% in 2010 — nearly a third of the list, by this site’s classification. And then it stopped. Every reading since has sat between 23% and 26%. On Forbes’ own 2026 labels it is 27%.
So the finance story is a step, not a slope. It happened once, over the readings from 2000 to 2007 — the gap in the data means the start cannot be dated more precisely than that — and the mechanism is reasonably well understood: hedge funds and private equity industrialised a compensation structure in which a manager keeps a share of a very large pool of other people’s money. That produced a lot of very large fortunes quickly, and it has kept producing them at a steady rate for two decades without producing more of them.
The dollars tell a different and more interesting story than the headcount. Finance’s share of listed wealth peaked at 26.9% in 2010, the end of a stretch from 2006 to 2011 in which it was both the most common sector on the list and the one holding the most money. It has slipped since: 19.2% in 2014, 17.1% in 2017, 14.6% in 2026 on this classification — or 20.1% on Forbes’ own labels for the same year, which is the gap between two taxonomies rather than two different facts. Either way the direction is the same. More finance people, holding a shrinking share of the money. Something else was growing faster.
The weekly email
How wealth actually works, once a week
The new explainers, the Million Dollar Question and the numbers behind them, in one short email. Free, and no ads.
We send a confirmation link first. One-click unsubscribe in every email; your address is never shared.
Technology: a fifth of the people, half the money
Technology’s path onto the list has two jumps and a long climb.
The first jump is the dot-com peak. Technology went from 4.0% of the 1994 list to 13.1% of the 2000 list, and from 8.0% of listed wealth to 31.8% — an extraordinary reading, and one to treat carefully, because the 2000 list was compiled near the top of the Nasdaq bubble. By 2002 technology’s share of wealth was back to 17.4%, where it stayed for a decade. Thirty-two percent of the money in one sector was not a new equilibrium; it was a market print.
The long climb runs from there to 2017: technology’s share of listed wealth sits between 17% and 22% for a decade, then rises to 24.9% in 2016 and 26.3% in 2017, while its share of members goes only from 9.1% to 13.9%. Fewer new technology billionaires than you would guess, each one much larger.
The second jump is recent and is mostly about a handful of people. On the 2025 list, technology held 42% of all listed wealth. On the 2026 list, 48%. Within that, the top five technology fortunes hold 54% of all technology wealth, and Elon Musk alone, at $908 billion, is 11% of the entire Forbes 400. The top ten members of the 2026 list hold 37.3% of its wealth, against 12.4% in 1982 and 25.1% at the dot-com peak in 2000.
“Technology is half the list’s wealth” and “technology is half of American wealth” are very different claims, and only the first is true. What has actually happened is that the largest fortunes on the list are now technology fortunes, and the largest fortunes have grown far faster than the rest of the list — so a sector that is a fifth of the members reads as half the money. Jensen Huang’s rise is the cleanest recent example: one stock, one position, no diversification, and a fortune that moves by tens of billions on a quarterly earnings call.
Which brings up the sector everyone wants to ask about. Is AI the next migration?
On the evidence so far, not yet — or not as its own category. Eight members of the 2026 list give artificial intelligence as their stated source of wealth, holding $117 billion between them, about 1.5% of the list. That is up from seven members and $60 billion in 2025: the wealth roughly doubled in a year, which is a real signal, but it is a signal at the scale of a rounding error. Forbes’ own framing is that despite the AI wave, technology remains the second most common industry on the list.
The honest reading is that AI currently shows up on the Forbes 400 mostly as a multiplier on existing technology fortunes — chips, cloud, search, servers — rather than as a new cohort of its own. Whether that changes depends on things that have not happened yet. Oil’s share of the list halved in four years once the price broke. It had taken rather longer than four years to build.
What people get wrong
That technology is the most common source of a great American fortune. It is the second most common, and has been for years. Finance puts more people on the Forbes 400 than any other sector, by a margin of twenty members in 2026. Technology dominates the money, not the membership — and the difference between those two statements is the single most useful thing in this data.
That finance replaced oil and then software replaced finance. Finance rose once, between the late 1990s and 2007, and has been flat as a share of members ever since. Nothing replaced it. Technology grew alongside it, in dollars rather than in headcount.
That the list’s sector mix measures the economy. It does not. It measures where very large concentrated ownership stakes are, which is a narrower thing. Manufacturing did not stop existing between 1982 and 2026; it stopped being owned in enormous private blocks by identifiable individuals. A sector full of widely held public companies and institutional shareholders produces few Forbes 400 members however large it is.
That falling off the sector chart means the money went away. The du Ponts vanish from the panel after 1998, yet Forbes’ 2026 estimate still puts the family’s combined wealth at $22 billion across heirs in the ninth generation. The chart counts individuals clearing a bar that rose to $4.4 billion in 2026, not families holding money.
That an industry label is a fact. It is a classification, made by an editor, over a business that may genuinely span four sectors. Forbes and this site’s classifier disagree on about one list member in six, and neither is simply right. Any chart of this kind is a reading, not a measurement.
Bottom line
Over forty-four years the Forbes 400 went from a list of oil and property fortunes to a list of finance and technology ones. Energy fell from a quarter of the members and a third of the money to under 8% of either. Real estate fell by roughly two-thirds. Manufacturing nearly disappeared in dollar terms. Finance rose once and stopped. Technology went from eight members holding 2% of the money to 88 members holding 48% of it.
But the sharpest change is not in the sector mix at all. It is in the concentration. In 1982 the top ten members held 12.4% of the list’s wealth; in 2026 they hold 37.3%, and one of them holds 11% on his own. The migration from oil to software is real, and it is the smaller half of what happened. The larger half is that the gap between the biggest fortune on this list and the typical one has widened to the point where the question “which sector is the list?” has two different right answers depending on whether you count people or dollars.
When someone says technology is where the money is now, they are correct about the money and wrong about the people. On this list, the most common way onto the list of the 400 richest Americans is still to work in finance — managing capital, whether other people’s or your own.
Methods and sources. Sector shares are computed from this site’s Forbes 400 panel: person-level data for 1982–2017 from Moretti and Wilson, “Taxing Billionaires: Estate Taxes and the Geographical Location of the Ultra-Wealthy,” American Economic Journal: Economic Policy 15(2), 2023 (openICPSR 157481), joined to Forbes’ 2025 and 2026 lists (the Forbes 400 landing page now serves the 2026 roster); list data are Forbes’. Sectors for 1982–2017 are assigned by this site from Forbes’ free-text source-of-wealth field using an ordered keyword classifier, resolved by earliest match position; the code is kept with the panel. Where more than one sector is named, the first one named wins. Entries stating only that wealth was inherited are held in a separate category rather than assigned a sector. Shares are taken over classified rows only; the unclassified share runs from 24% of the 2000 list down to zero in 2026 and is reported per year in the panel’s fact pack. Rows that are family aggregates rather than individuals are excluded throughout — bare surnames, rows naming a family, and and nine rows under two du Pont names carrying $8–10 billion each in 1982–84 and 1989–94, years whose documented number one ran from $2.0 billion (Daniel Ludwig, 1982) to $9.35 billion (Bill Gates, 1994). The exclusion is by value as well as by name: the same du Pont name appears at $200–300 million in 1985–87, which is an individual rather than the family, and those rows are kept. Those aggregate rows are why the source lists run past 400 entries in 1982–84 and 1989–94. There is no usable source-of-wealth text for 1995–99 or 2001, and no open person-level list for 2018–24; the chart breaks across both and nothing is interpolated. Against Forbes’ own industry field for 2025–26 the classifier agrees on 83.1% of 792 rows; against Forbes’ published 1982 breakdown (Luisa Kroll, Forbes, October 2010, p. 20, as cited on Wikipedia) it is within 1.7 points on all four categories Forbes reported, measured over the same universe. 2025 and 2026 figures quoted as Forbes’ own — the 108/88 member counts, the $3.9 trillion and $1.6 trillion sector totals, the $8 trillion list total, the $4.4 billion cutoff and Musk’s $908 billion — come from Forbes and reconcile exactly with the panel’s own cross-sections; figures quoted from the chart use this site’s classifier and will differ by a point or two from Forbes’ labels for the same year. Crude oil prices are the U.S. Energy Information Administration’s U.S. Crude Oil First Purchase Price, annual, nominal dollars per barrel, release of 2 November 2026. Dollar figures in this post are nominal unless stated; sector shares are ratios within a single year and are therefore unaffected by inflation. One 1983 row (a $5 billion Hunt entry with a duplicated source string) appears to be a parsing artifact in the source data; no 1983 figure is cited here.
A note on the 2025 list. Forbes has since restated its archived 2025 Forbes 400: 34 of its 400 names, all near the bottom of the list (mostly $3.8–4.9 billion), now differ from the version used here, a roster difference of about $64 billion, or under 1% of the total. The cutoff ($3.8 billion) and the top ($428 billion) are unchanged. We keep the list as Forbes first published it, the version behind its September 2025 “$6.6 trillion” headline, so that every post in this series and the interactive history rests on the same roster. Sector shares for 2025 are affected only at the margin, since the differing names are small relative to the total.
Related reading: The Forbes 400: The 1982 List, 44 Years Later · The Forbes 400: The Price of Admission · The Forbes 400: Churn · The Forbes 400, 1982–2025: the panel explorer · Anatomy of the Forbes 400: Who’s Actually On the List · Tech Wealth: How Founders and Investors Live Differently · Hedge Funds and Private Equity: The Other Engine of Modern Finance Wealth · Generational Wealth: How Long Fortunes Actually Last