

Part 3 of 3 in the series The Forbes 400. See every installment →
The Million Dollar Question: Of everyone on a given year’s Forbes 400, what share — the same individuals, not their heirs — is still on the list 20 years later?
Read on for the answer.
Every family-wealth seminar seems to open with the same two lines. The first is a proverb: shirtsleeves to shirtsleeves in three generations. The second is a statistic: seventy percent of wealthy families lose their wealth by the second generation, ninety percent by the third. Together they make a tidy story: fortunes are fragile, heirs are feckless, the money runs out.
The Forbes 400 is the closest thing America has to a long-run, public, named record of the very largest fortunes. It has been published every autumn since 1982. If fortunes dissolve on a predictable schedule, this is where you would expect to see it.
So this piece does the obvious thing. It takes every year’s list as a cohort and asks how many of the same people are still on it five, ten, twenty and thirty years later. Then it asks what that number can and cannot tell you about the folklore — because the honest answer is that the list measures something narrower and stranger than “losing the money,” and the gap between the two is where most of the misunderstanding lives.
How to measure churn
The measurement is simple to state. Take everyone on the list in a given year — the cohort — and count how many of those same individuals appear on the list again a set number of years later. Divide. That is the cohort’s survival rate at that horizon.
Three choices sit underneath the number, and each one matters.
It counts people, not families. If Sam Walton is on the 1982 list and his children are on the 2025 list, the 1982 Sam Walton entry did not survive — he died in 1992 — even though the fortune plainly did. This is deliberate. Person survival is something the data can measure cleanly; family survival requires deciding who counts as family, which is a judgment call (more on that below). The two are different questions, and blurring them is the single most common error in writing about this subject.
It tests presence, not continuity. Someone who drops off in a bad year and returns two years later counts as surviving at any horizon where they’re listed. A survival rate here means “on the list in year N,” not “never left.”
It uses a research panel, with a hole in it. The figures come from the person-level Forbes 400 panel that Enrico Moretti and Daniel Wilson assembled for “Taxing Billionaires: Estate Taxes and the Geographical Location of the Ultra-Wealthy” (American Economic Journal: Economic Policy, 2023), deposited as openICPSR project 157481. That panel runs continuously from 1982 to 2017. This site has joined it to Forbes’ 2025 list. No open, person-level source covers 2018 through 2024, so there is no measurement for those years at all — any cohort whose target year lands in that window simply has no figure, and nothing here is interpolated across it.
None of this is new ground. Sociologists and economists have worked these panels for a decade — Korom, Lutter and Beckert on 1982–2013, Fernholz and Hagler on dynastic families from 1985 to 2020, and Arnott, Bernstein and Wu in the Cato Journal. What follows is an attempt to make the basic survival numbers legible, not a claim to have discovered them.
The survival curve
Here is the typical shape, averaging every cohort for which the data exist:
| Years later | Cohorts measured | Average share still listed | Range across cohorts |
|---|---|---|---|
| 5 | 31 | 62% | 44% – 74% |
| 10 | 27 | 45% | 30% – 56% |
| 20 | 17 | 22% | 18% – 27% |
| 30 | 7 | 10% | 8% – 14% |
As a rule of thumb: of any year’s Forbes 400, about three in five are still there five years on, fewer than half at ten, about one in five at twenty and one in ten at thirty.
The answer to the Million Dollar Question is B. Across the 17 cohorts with a 20-year reading (1982 through 1997, plus 2005), an average of 22% of the same individuals were still listed two decades later. No cohort fell below 18% or rose above 27%.
One cohort, followed all the way, shows the curve in miniature. The 1985 list had 398 entries. Ten years later, 161 of those people were still on it (40%). Twenty years later, 85 (21%). Thirty years later, 40 (10%). In 2025 — forty years on — 17 were still there: just over 4%.
The very first list decays the same way. Of the 436 entries in the 1982 data, 176 were present in 1992, 80 in 2002, 34 in 2012, 24 in 2017 and 13 in 2025. Those 13 are names most readers would recognize: Warren Buffett, Charles Koch, Phil Knight, Philip Anschutz, Donald Bren, Donald Newhouse, Leonard Stern, Donald Trump, Ray Lee Hunt, Gordon Getty, George Lucas, Ronald Lauder and Sid Bass. (Newhouse has since died, Forbes reported in 2026.) Arnott, Bernstein and Wu, using their own count, found 34 of the inaugural names still on the 2014 list; the two panels tell the same story.
Notice what the 13 have in common besides money: age. Every one of them was 53 or younger when the first list appeared, and several — Trump, Lucas, Lauder, Ray Hunt — were in their thirties. A forty-three-year survival on any list of human beings requires, first of all, being alive for forty-three more years. Much of what looks like long-horizon churn is simply mortality, and the panel does not code why anyone left, so it cannot separate the two.
Has churn risen or fallen?
It has fallen. The list has become stickier.
The cleanest way to see it is the ten-year rate, which has the most cohorts. One complication has to be handled first: the source data carry more than 400 entries in some years — 436 to 475 in 1982–84, and roughly 500 in 1989–94. A bigger starting cohort, or a bigger target year, mechanically moves the survival rate, so comparing those years with the 400-entry years is not like with like. That likely accounts for much of the apparent dip in the 1989–1994 cohorts in the chart below.
Restricting the comparison to cohorts where both the starting year and the target year have about 400 entries:
- The 1985–1988 cohorts kept an average of 42% of their members ten years later.
- The 1995–2006 cohorts that meet the same test, plus 2015, kept an average of 50%.
The 20-year rate moves the same way on the same test: about 23% for the 1985, 1986 and 1988 cohorts against about 27% for 1995–97 and 2005. The five-year rate can’t be compared cleanly across the decades, because every five-year target from the 1980s cohorts lands in an oversized year — but for what it is worth, the 2008–2011 cohorts each kept 71–73% of their members after five years, among the highest readings in the panel.
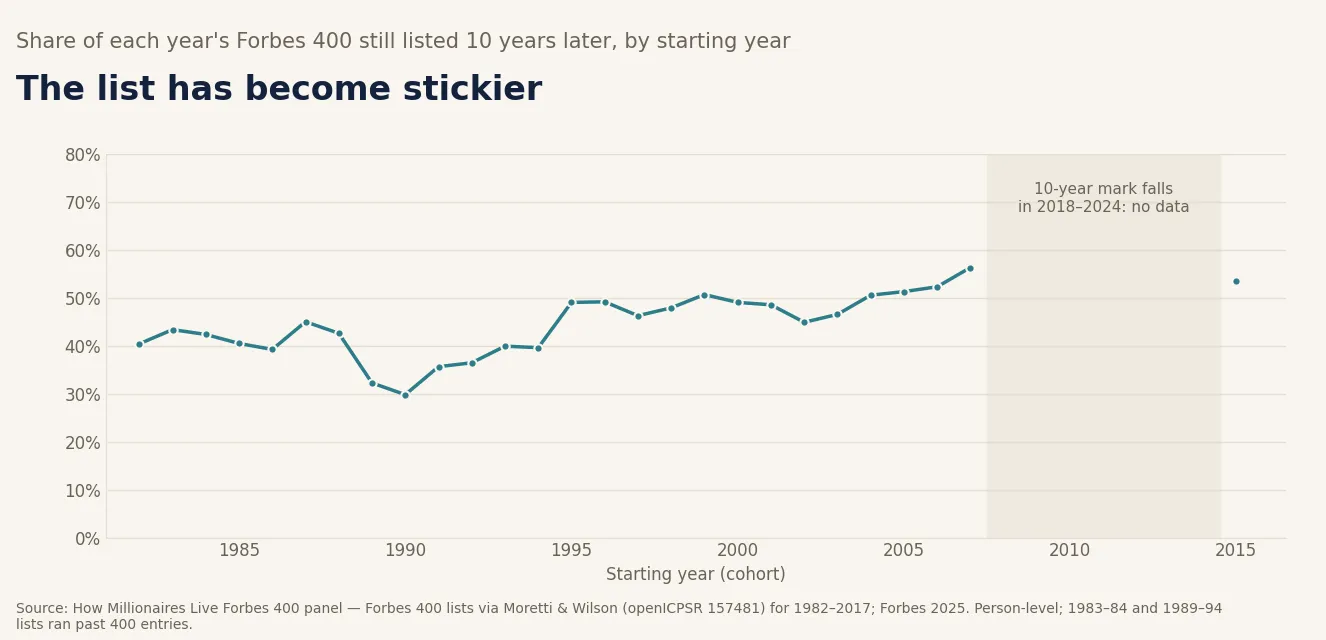
The 2015 cohort is the latest with a ten-year reading: 214 of its 400 members were on the 2025 list, or 53.5%.
That direction matches the academic work. Fernholz and Hagler, using a family-linked panel, report that the five-year rank correlation among the richest families “went from around 0.55 in the late 1980s to more than 0.7 after 2010” — in their words, “a clear downward trend in mobility from 1985-2020” (Economics Letters, 2023).
Why the list has grown stickier is a separate question, and the panel alone can’t answer it. Plausible contributors include founders holding very large single-company stakes through long bull markets, and the simple fact that a fortune growing faster than the cutoff stays on. Those are hypotheses, not findings here.
The newest list is consistent with the pattern but sits outside the panel. Forbes’ 2026 Forbes 400, published on 15 September, reports 360 people who made both the 2025 and 2026 lists, 34 newcomers, 34 members who dropped off and six who died during the year — a one-year retention of 90%, with a record cutoff of $4.4 billion.
How long a Forbes 400 career lasts
Flip the question from cohorts to people. The panel contains 2,011 distinct individuals who appeared at least once between 1982 and 2025.
- The median career is five listed years. The middle half of all careers runs from two to eleven years.
- Roughly one in five is a one-year visitor. Among the 1,835 people first listed by 2016 — leaving out those whose only chance to reappear falls in the unmeasured years — 18% were listed exactly once.
- About 28% of everyone reached ten or more years; about 11% reached twenty or more; about 3% thirty or more.
- Ten people appear in all 37 years the panel covers.
- Leaving and coming back is common. Of the people first listed by 2016, 30% have at least one measured year missing between their first and last appearance. Some of that is real — a fortune dipping below the line in a bad market and recovering — and some reflects the years when the source lists ran longer than 400, which let people near the bottom flicker in and out.
The 1982 cohort lasted longer than average, with a median of 7.5 listed years. Only 14% of its members appeared just once.
Where “shirtsleeves to shirtsleeves” comes from
Before deciding whether the data confirm the folklore, it helps to know what the folklore is.
The phrase is usually credited to Andrew Carnegie. Phrase historian Pascal Tréguer, who traced it through digitized newspapers and periodicals, found no evidence for that attribution. The earliest printing he located is from 1874, in Appletons’ Journal, where the critic Edmund Clarence Stedman, in a portrait of the essayist Charles Dudley Warner, already puts “but three generations from shirt-sleeves to shirt-sleeves” in quotation marks, as a known saying; by 1882 the economist Edward Atkinson was calling it “an old saying” in The Atlantic.
It has an older English cousin. “Clogs to clogs” — clogs being the footwear of Lancashire mill workers — appears in print by 1842, when William Cooke Taylor wrote that there was “but one generation in Lancashire between clog and clog,” and in its three-generation form in the Lancashire press by 1868. Versions are attributed to many other cultures; the Chinese saying usually rendered as “wealth does not pass three generations” is the most often quoted. These are proverbs, which is to say observations about striking cases, not measurements.
The statistic is a different matter, because it claims to be a measurement. Its 70% core is most often sourced to the consultancy The Williams Group — Roy Williams and Vic Preisser, authors of Preparing Heirs (2003); the “90% by the third generation” tail is usually appended by whoever repeats it. The research is described as a 20-year study of more than 3,250 families that found “70% of intergenerational wealth transfers fail,” but the data, sampling and definitions have not been published in a form anyone can check.
Even the claim drifts. The Institute for Preparing Heirs’ own site states it as “70% of unprepared families lose control of assets and family unity by the third generation” — a different generation, a qualifier (“unprepared”), and an outcome (“control of assets and family unity”) that is not the same thing as losing the money.
The weekly email
How wealth actually works, once a week
The new explainers, the Million Dollar Question and the numbers behind them, in one short email. Free, and no ads.
We send a confirmation link first. One-click unsubscribe in every email; your address is never shared.
The family-wealth psychologist James Grubman has argued (2022) that the universal “70% rule” derives primarily from a 1987 family-business study by John Ward: “a 70% failure rate of family businesses is simply the inverse of a continuity rate of 30%,” he writes, adding that there is “no other substantiated evidence.” Ward tracked 200 Illinois manufacturers from 1924 to 1984, and as Family Business magazine has pointed out, even his figures are routinely misquoted — and his test counted only firms that survived as independent companies under the same name, so a business that was sold or merged, sometimes very profitably, did not survive. A family that sells the company for a fortune has not gone back to shirtsleeves.
Falling off is not going broke
Now the central caution. A Forbes 400 survival rate of 22% after twenty years does not mean 78% of those people or families lost their money. Four things push people off the list that have nothing to do with ruin.
The bar keeps rising. The entry cutoff was $75 million in 1982 — about $250 million in 2025 dollars. In 2025 it was $3.8 billion, and in 2026 Forbes put it at $4.4 billion. To stay on the list from 1982 to 2025, a fortune sitting at the original cutoff had to grow about 50-fold in nominal terms — roughly 9.6% a year, every year, for 43 years, after spending, taxes and gifts. One that merely kept pace with inflation would be worth about $250 million today: a very large fortune and one-fifteenth of what it takes to be listed. (The threshold post in this series covers this in detail.)
Even survivors show how hard that is. Gordon Getty was on the 1982 list at $1.4 billion — about $4.7 billion in 2025 dollars. In 2025 Forbes put him at $5.5 billion: still listed, but only modestly above where he started in real terms. Sid Bass went from $1.0 billion (about $3.3 billion in today’s dollars) to $3.8 billion, which is to say exactly at the 2025 line.
Fortunes split. When one person’s fortune is divided among several children, each share can fall below the cutoff even if the total grows. The reverse also happens with very large fortunes: Sam Walton was a single 1982 entry; the 2025 list has five Waltons. Forrest Mars Sr. was one 1982 entry; the 2025 list has six members of the Mars family, his children and grandchildren. In person-level terms, neither founder “survived.” In family terms, both fortunes thrived.
The du Ponts show the dilution case. The 1982 data contain ten entries under the du Pont name, some of them family aggregate rows, plus heirs listed under married names; the name does not appear in the panel after 1998, nor on the 2025 list. Yet Forbes’ 2026 estimate puts the family’s combined wealth at $22 billion, held by heirs now in their ninth generation. The family did not go back to shirtsleeves. It simply stopped producing individuals rich enough to clear a $4 billion bar.
Philanthropy. Some fortunes leave the list on purpose. David Packard, a 1982 listee, died in 1996 and left the bulk of a roughly $4 billion estate to the David and Lucile Packard Foundation. In the panel, that is an exit. In reality it is a decision about where the money should go.
Death. Every cohort loses members to death every year — six members of the 2025 list died before the 2026 list was compiled — and death is not a financial event at all.
Arnott, Bernstein and Wu built their argument on exactly these mechanisms. In “The Myth of Dynastic Wealth: The Rich Get Poorer” (Cato Journal, Fall 2015), they argue that spending, division among heirs, taxes and philanthropy erode large fortunes faster than investment returns rebuild them, and estimate that each cohort of Forbes 400 families owns less than half of all Forbes 400 wealth just 23 years later. They also found 69 inaugural families represented on the 2014 list, only 36 of which had made every list in between — family counts, not person counts, and their wealth finding measures share of the list rather than absolute wealth.
Korom, Lutter and Beckert, looking at the same list from a sociological angle, reached a finding that pulls the other way: heirs are more likely to remain on the list than self-made entrepreneurs, all else equal. Both can be true. Inherited fortunes may be steadier from year to year while still losing ground, over decades, to the new fortunes that keep arriving above them.
What people get wrong
That falling off the list means losing the money. It usually means not keeping up with a cutoff that has risen fifty-fold since 1982, or being divided among heirs, or giving it away, or dying. The Forbes 400 measures rank, not solvency.
That the 70% statistic is a research finding. Its underlying data have never been published, it is quoted with different generations and definitions, and at least one specialist traces it to a 1980s study of Illinois family businesses rather than family wealth.
That Andrew Carnegie said it. There is no evidence he did. The earliest known American printing is from 1874, and Lancashire’s “clogs to clogs” is decades older.
That person survival and family survival are the same thing. Sam Walton’s individual entry ended in 1992; the Walton fortune is larger than ever. A family surname still on the list also proves nothing without checking kinship — the 2025 list has a Hunt from the H.L. Hunt oil family and a Hunt from the J.B. Hunt trucking company, who are not related.
That the list is getting more volatile. Measured like for like, it has become stickier. Mid-1990s and later cohorts kept about half their members for a decade; mid-1980s cohorts kept about two-fifths.
Bottom line
About three in five members of a Forbes 400 cohort are still there five years later, fewer than half after ten, about one in five after twenty and about one in ten after thirty. That is real churn — but it is churn in a ranking, against a bar that rises much faster than inflation, among people who are mostly old enough that the list loses some of them every year for reasons no financial planner can fix.
That makes the list a poor test of “shirtsleeves to shirtsleeves,” and anyone who uses it as one, in either direction, is overclaiming. What the list does show is narrower and more useful: staying among America’s 400 largest fortunes is hard and getting slightly easier, the individuals who last for decades are mostly people who arrived young, and the families that drop off — the du Ponts are the clearest case — are often still extraordinarily rich.
The proverb is a proverb. The 70% figure is not a measurement. The best public measurement available says that the money tends to outlast the place on the list, and that the place on the list is the only thing the list can count.
Methods and sources. Survival figures are computed from this site’s Forbes 400 panel: person-level data for 1982–2017 from Moretti and Wilson, “Taxing Billionaires: Estate Taxes and the Geographical Location of the Ultra-Wealthy,” American Economic Journal: Economic Policy 15(2), 2023 (openICPSR 157481), joined to Forbes’ 2025 Forbes 400; list data are Forbes’. No source year exists for 2018–2024, so cohorts whose target year falls in that window have no reading and nothing is interpolated. A cohort’s survival rate at horizon h is the share of its rows whose same individual (person_id) is listed in year t+h, whether or not they were listed continuously; heirs are new individuals, so the figures measure person survival, not family or fortune survival. Cohort counts include the few rows Forbes printed as a single family entry. Averages in the survival table weight each cohort equally; pooling all cohort members instead gives 61%, 44%, 22% and 10%. The source data carry more than 400 rows in 1982–84 and 1989–94; the trend comparison therefore uses only cohort–target pairs where both years have 394–401 rows (ten-year: 1985–88 against 1995–96, 1998–2001, 2003–06 and 2015). Career statistics come from the panel’s per-person summary of 2,011 individuals; the one-year and returner shares are restricted to people first listed by 2016, and a “returner” is anyone with at least one panel year missing between their first and last listing. The panel does not code reasons for exit. Real-dollar figures are in 2025 dollars using the BLS CPI-U, U.S. city average, annual average (series CUUR0000SA0). Figures reflect the panel’s corrected identity build of 1 October 2026, which fixed name matching for short-form 2025 names and a two-year age error in the 2015 source year; two people (Phil Knight and Philip Anschutz) remain split into duplicate IDs for 2015 alone, which very slightly understates readings that land on 2015. Ages of the 13 1982-to-2025 survivors are from their published birth years. 2026 figures are from Forbes and are not in the panel. Phrase histories are from Pascal Tréguer’s Word Histories; the Williams Group study description is as reported, since the study itself is unpublished; the reading of the 70% figure as an inversion of Ward (1987) is James Grubman’s. Academic citations: Fernholz and Hagler, Economics Letters 230 (2023); Korom, Lutter and Beckert, Social Science Research (2017); Arnott, Bernstein and Wu, Cato Journal 35(3), Fall 2015.
A note on the 2025 list. Forbes has since restated its archived 2025 Forbes 400: 34 of its 400 names, all near the bottom of the list (mostly $3.8–4.9 billion), now differ from the version used here, a roster difference of about $64 billion, or under 1% of the total. The cutoff ($3.8 billion) and the top ($428 billion) are unchanged. We keep the list as Forbes first published it, the version behind its September 2025 “$6.6 trillion” headline, so that every post in this series and the interactive history rests on the same roster. A few long-listed names (among them Steve Wynn, Ira Rennert and Mitchell Rales) appear on the restated roster but not on ours, so survival readings that land on 2025 may be very slightly understated; readings for other years are unaffected.
Related reading: The Forbes 400: The 1982 List, 44 Years Later · The Forbes 400: The Price of Admission · The Forbes 400, 1982–2025: the panel explorer · Generational Wealth: How Long Fortunes Actually Last · Dynasties: Families That Turn Wealth Into Power · Anatomy of the Forbes 400: Who’s Actually On the List · Philanthropy: Giving, Status, and Influence