

Part 2 of 3 in the series The Forbes 400. See every installment →
The Million Dollar Question: In today’s dollars, roughly what did it take to make the very first Forbes 400, in 1982?
Read on for the answer.
Every list has a last name on it. On the Forbes 400, whoever sits at number 400 sets the price of admission: the smallest fortune that still counts as one of the 400 largest in the country.
In September 2025 that price was $3.8 billion. In the first list, in 1982, it was $75 million. Those two numbers are forty-three years and two very different dollars apart, so on their own they say less than they seem to. This piece puts them on the same footing, follows the cutoff year by year through the 1982–2017 research panel behind the first post in this series, and asks the question the headline number begs: faster than what?
The short answer is that the floor of the list rose about fifteen-fold after inflation. That is much faster than prices, faster than the economy, and much faster than the typical American household’s net worth. It is also, perhaps surprisingly, slower than an untouched index fund. Both halves of that answer matter.
What “price of admission” actually measures
The cutoff is the net worth of the poorest person on the list. It is not what a “typical” member is worth, and it is not a measure of how rich the top got. It is a measure of how much you need to be in the room at all.
It is useful because it ignores the outliers at the top — the cutoff doesn’t move when one founder’s stock triples. It is slippery because it depends entirely on how the bottom of the list is drawn, and in the early years the record isn’t clean.
Take 1982. The research panel this series uses records the lowest entry that year at $75 million, the figure Forbes itself used in its 2012 list package. But Forbes has not been consistent: a 2014 Forbes retrospective put the 1982 floor at $91 million, naming Mike Markkula, then Apple’s chief executive, as the poorest person on the list, while a 2021 Forbes anniversary piece gave $100 million. This piece uses the panel’s $75 million because every other year’s figure comes from the same source and method, but the disagreement is real and it moves the headline: measured from $91 million or $100 million, the real rise to 2025 is about 12.5-fold or 11.4-fold rather than 15-fold.
To compare across decades, every figure here is converted to 2025 dollars using the Consumer Price Index for All Urban Consumers (CPI-U), annual average. Prices in 2025 were about 3.34 times their 1982 level, so $75 million in 1982 is about $250 million in 2025 money.
So the answer to the Million Dollar Question is C) about $250 million. B is the trap — $75 million is the 1982 sticker price, not today’s equivalent. If you take Forbes’ own later restatements instead, the 1982 floor converts to roughly $300 million to $335 million, which is still nearer C than D.
Forty-three years in one line
Here is the cutoff in 2025 dollars, year by year:
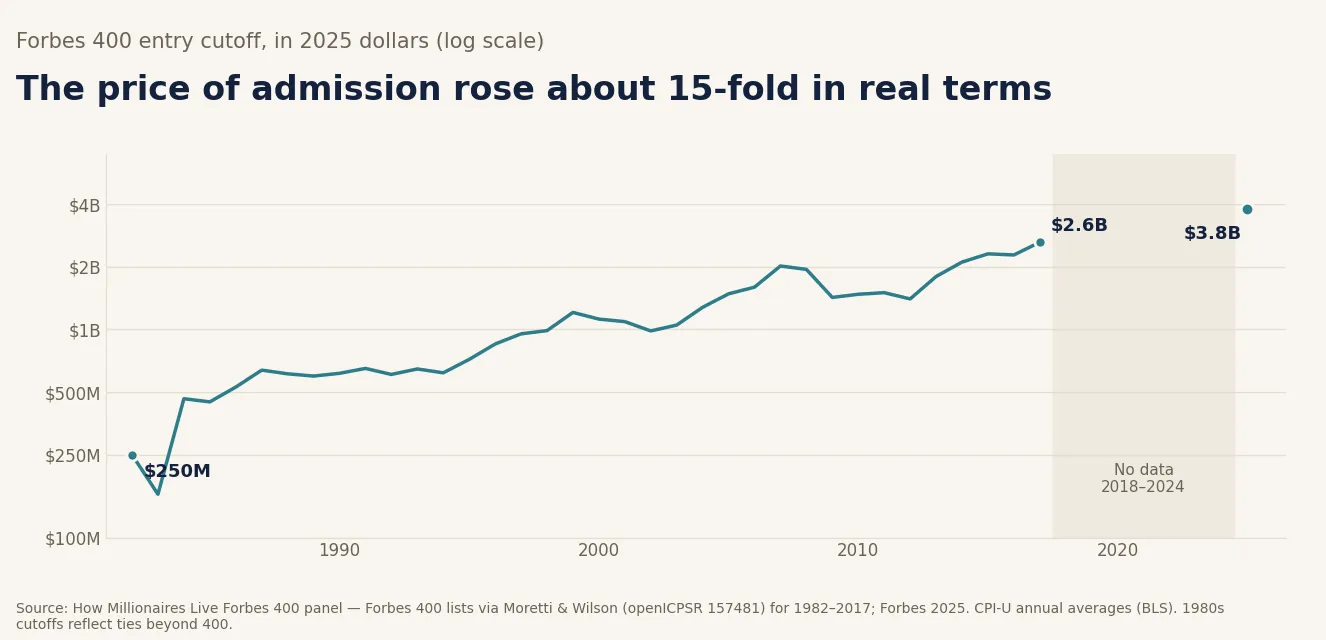
The chart uses a logarithmic scale, so equal vertical distances mean equal percentage changes. On an ordinary scale the 1980s would be a flat line on the floor and every recent wiggle would look like a cliff.
There is a visible break between 2017 and 2025. The panel is built from a research dataset that runs continuously from 1982 to 2017, and then from Forbes’ published 2025 list; the seven lists in between are not in it. Nothing in this piece is measured for 2018 through 2024, and the chart does not draw a line across the gap because we don’t know what path the cutoff took — only where it started and ended.
The headline arithmetic, recomputed from the panel:
- Nominal: $75 million in 1982 to $3.8 billion in 2025, a 50.7-fold increase.
- Real (2025 dollars): $250 million to $3.8 billion, a 15.2-fold increase — about 6.5% a year above inflation, compounded over 43 years.
- The list as a whole: the panel’s combined net worth rose from $420 billion (in 2025 dollars) to $6.65 trillion, a 15.8-fold real increase.
That last figure needs a caveat that runs in the opposite direction from the cutoff’s. The panel’s 1982 total, $125.9 billion in 1982 dollars, is well above the $92 billion Forbes itself reports for that list. Part of the gap is documented: the panel carries 436 rows for 1982 rather than 400, and the du Pont fortune appears in its early years both as family aggregate rows and as individual family members, so some of that wealth is counted twice. Whether those two causes account for all of the difference is not something the panel’s documentation settles. Measured from Forbes’ $92 billion, the real growth in the list’s total is closer to 22-fold. Either way, the total grew at least as fast as the floor.
The years it moved
The cutoff did not rise smoothly. Most of the climb happened in three bursts, separated by long flat stretches and two sharp drops.
1984–1995: the long flat. After an early jump, the real cutoff spent most of a decade between about $450 million and $720 million in today’s money. In real terms, getting onto the 1994 list required about $620 million — roughly what it took in 1987.
1995–1999: the first surge. In four years the cutoff went from $340 million to $625 million in nominal terms, and from $718 million to $1.21 billion in 2025 dollars — a 68% real increase, or nearly 14% a year. This is the dot-com and late-1990s bull market arriving at the bottom of the list.
2000–2002: the first drop. The real cutoff fell three years running, to $984 million in 2002 — about 19% below the 1999 peak. A fortune that had been comfortably inside the list in 1999 could fall off without its owner doing anything but holding it.
2002–2007: the second surge. From that low the real cutoff doubled in five years, to $2.02 billion in 2007 — roughly 15% a year, the fastest sustained climb in the panel after the early 1980s. 2006 was the first year a billion dollars was the minimum.
2008–2009: the crash. The 2009 cutoff was $950 million, down from $1.3 billion — a 27% fall in nominal terms and the deepest one-year drop in the panel, leaving aside the unreliable 1983 entry discussed below. Note the timing: Forbes compiles the list in late summer, so the 2008 list was measured before the September 2008 collapse and the 2009 list after it. The crash shows up a year “late.”
2009–2017: the third surge. In real terms the cutoff rose in every year but two, going from $950 million to $2 billion nominal — an 84% real increase over eight years, about 8% a year. It took until 2014 just to regain the 2007 level in real terms.
2017–2025: the gap. The real cutoff rose from $2.63 billion to $3.8 billion, about 4.7% a year on average. That is an average between two endpoints, not a path: the years in between include a pandemic crash and a boom, and the panel doesn’t see either.
One thing these episodes have in common: the cutoff tracks asset prices, not anyone’s effort. In 12 of the 33 consecutive year-to-year steps from 1984 to 2017 (leaving out the steps into and out of 1983), the real cutoff went down.
Where the data has seams
One year in the panel looks wrong, and it should not be hidden.
1983. The panel’s 1983 cutoff is $50 million — lower than 1982, in a year when the stock market rose by more than a fifth. Forbes’ 2014 retrospective puts the published 1983 floor at $125 million. The explanation is in the row count: the panel holds 457 rows for 1983, not 400. The research file keeps more than 400 rows in several years — 1982 through 1984 and 1989 through 1994 all run from 436 to 509 rows — because it keeps people tied at the bottom and, in some years, lists family members individually. In those years the lowest row in the panel is not Forbes’ number 400, and it can sit below the minimum Forbes published. The larger row count also inflates the 1983 total, about $164 billion against $126 billion in 1982. We treat the 1983 floor as unreliable and don’t use it for any comparison; the chart still draws it, as the dip just after 1982.
The same effect shows up more mildly elsewhere. For 1989, the panel’s floor is $230 million against a Forbes-published $275 million; for 2000, $600 million against $725 million. In the years we checked against that retrospective — 1982, 1983, 1989, 2000 and 2003 — the panel’s floor was never higher than Forbes’: lower in four, and identical in 2003, at $600 million. If anything, then, the panel slightly understates how high the bar was in some years.
None of this changes the long-run picture: the headline rests on the 1982 and 2025 endpoints, and the 2025 figure comes straight from Forbes.
Faster than what?
A number that grew fifteen-fold needs a yardstick. Here are four, each measured as carefully as the data allow.
Prices. Consumer prices rose 3.34-fold from 1982 to 2025. The nominal cutoff rose 50.7-fold. That gap is the whole 15.2x.
The economy. U.S. nominal GDP rose from $3.34 trillion in 1982 to $30.9 trillion in 2025, a 9.2-fold increase, according to the Bureau of Economic Analysis via FRED. In real terms the economy grew about 3.3-fold, and real GDP per person — dividing by BEA’s population series — about 2.2-fold. So the price of admission rose roughly five and a half times faster than the economy did. Put another way: in 1982 the cutoff was about 22 millionths of annual GDP; in 2025 it was about 123 millionths.
The typical household. The Federal Reserve’s Survey of Consumer Finances is the standard source for household wealth, and its consistent series starts in 1989. In the Fed’s historical tables, median family net worth was $108,500 in 1989 and $120,000 in 2016, both in 2022 dollars — an 11% real rise in 27 years. Over the same span, the Forbes 400 cutoff rose 3.8-fold in real terms. By our calculation (both converted to 2025 dollars), the 1989 cutoff was about 5,000 times the median family’s net worth; by 2016 it was about 17,000 times.
The median family then had a strong few years: the Fed reports a 37% real jump between 2019 and 2022, to $192,900. Matching survey years is not possible after 2017 because the panel has no 2019 or 2022 list, but setting the 2025 cutoff against the 2022 median (adjusted to 2025 dollars) gives a ratio near 18,000 — again our calculation, not the Fed’s. The middle had a good stretch; the floor of the top 400 moved further.
The stock market. This is the comparison that cuts the other way. Compounding Aswath Damodaran’s annual S&P 500 returns, which include reinvested dividends, over the 43 calendar years 1982 through 2024 multiplies a dollar about 130-fold; shifting the window a year later, to 1983 through 2025, gives about 127-fold. The cutoff rose about 51-fold over a comparable span.
Read literally, that means someone holding exactly the 1982 cutoff — $75 million — who put all of it into an S&P 500 index fund, paid no tax, spent nothing, gave nothing away and left it to no one would have had over $9 billion by 2025, comfortably more than twice the $3.8 billion floor. Nobody did that, of course, and the gap between that hypothetical and reality is most of the story of how fortunes leave the list: taxes, spending, philanthropy, and above all division among heirs. (The 1982 index fund is also a stylized comparison: the panel’s earliest fortunes were mostly private oil, real estate and family companies, not diversified portfolios, and the S&P started its great run almost exactly when the first list was compiled, in the summer of 1982.)
The cutoff, then, grew faster than prices, than output and than the median household — but slower than the market’s best-case compounding. That is consistent with a list whose floor is set by asset prices and whose membership is constantly being reshuffled as individual fortunes fall behind them, which is the subject of the next post in this series.
The floor, the middle and the top
A cutoff is one point on a distribution, and a single point hides the shape. The panel also records each year’s median (the 200th-richest person, roughly) and mean.
The weekly email
How wealth actually works, once a week
The new explainers, the Million Dollar Question and the numbers behind them, in one short email. Free, and no ads.
We send a confirmation link first. One-click unsubscribe in every email; your address is never shared.
| 1982 | 2017 | 2025 | |
|---|---|---|---|
| Cutoff (2025 dollars) | $250M | $2.63B | $3.80B |
| Median (2025 dollars) | $554M | $4.93B | $7.45B |
| Mean (2025 dollars) | $963M | $8.82B | $16.6B |
| Median ÷ cutoff | 2.2 | 1.9 | 2.0 |
| Mean ÷ median | 1.7 | 1.8 | 2.2 |
Source: Forbes 400 data via the Moretti–Wilson panel (1982, 2017) and Forbes (2025); CPI-U conversion by How Millionaires Live. The 1982 figures include the panel’s 36 rows beyond 400.
Two patterns stand out.
The bottom half of the list has kept roughly the same shape. The median listee has been worth about twice the cutoff in all three years, and between about 1.4 and 2.5 times it in every other year the panel measures except the unreliable 1983. The real median rose about 13.5-fold from 1982 to 2025, a little less than the cutoff’s 15.2-fold. Climbing from the floor to the middle of the list takes about the same multiple it always did.
The top has stretched away from the middle. The mean was 1.7 times the median in 1982 and 2.2 times it in 2025; in real terms the mean rose about 17-fold. That divergence is mostly a 2017–2025 phenomenon — the ratio barely moved from 1982 to 2017 — and it reflects the handful of founder fortunes in the hundreds of billions that now sit at the top, the subject of Life at $1 Trillion. A single cutoff number cannot show that; it rose more slowly than the average because the gains were concentrated far above it.
So “the price of admission rose 15-fold” and “the Forbes 400 got 15 times richer” are not the same statement.
Who the floor now keeps out
The most direct consequence of a rising cutoff is that being a billionaire no longer gets you on the list. The panel’s cutoff first reached $1 billion in 2006, slipped back to $950 million after the 2009 crash, and has been above $1 billion in every year it measures since 2013; by 2025 it was nearly four times that. Forbes counted a record 500 American billionaires who were too poor to make the 2025 list.
Forbes has now published its 2026 list, and it is not in this panel, so treat these figures as context only. According to Forbes’ release on September 15, 2026, the 2026 cutoff is $4.4 billion, $600 million higher than in 2025, and the 400 are collectively worth a record $8 trillion. Forbes also counts 590 American billionaires who fell short. In nominal terms, $4.4 billion is about 59 times the 1982 floor. (It isn’t converted to 2025 dollars here because 2026 has no full-year CPI average yet.)
What does a rising floor mean for who can get on? Three things follow from the data:
The list increasingly measures one kind of wealth. At $3.8 billion or $4.4 billion, the fortunes that qualify are overwhelmingly large equity stakes — founders’ shares, controlling family holdings, investment firms. A highly paid surgeon, a successful dentist with a property portfolio, or the owner of a profitable regional business will not get near it; even a very rich family office client often won’t. The gap between “rich” and “Forbes 400” has widened every decade, which is part of what Wealth Levels tries to map.
Staying on is a race against the floor. A fortune that grows at, say, 5% a year after inflation is shrinking relative to a cutoff that grew 6.5% a year. A fortune can fall off the list without shrinking at all — the threshold simply moves faster than it does. The churn post measures how often that happens.
Heirs face it hardest. A fortune split among four children starts each of them at a quarter of the original. Against a floor that has risen fifteen-fold in real terms, inherited fortunes that are divided tend to drop off the list person by person even when the family as a whole stays very rich. That’s why the series separates person-level survival from family continuity, and why families such as the Waltons and the Marses, whose holdings stayed concentrated in a single company, still have several members on the list. Generational Wealth and Dynasties cover the mechanics.
What people get wrong
“The cutoff went from $75 million to $3.8 billion, so it rose fifty-fold.” In nominal dollars, yes. In constant dollars it rose about 15-fold — and less than that if you accept Forbes’ own later statements of the 1982 floor. Comparing raw dollars across 43 years overstates the change by a factor of more than three.
“The rise just reflects inflation and economic growth.” It doesn’t. Prices rose about 3.3-fold and the real economy about 3.3-fold; the cutoff rose about 15-fold after inflation. Even against nominal GDP, the cutoff grew about five and a half times faster.
“The rich got richer faster than the stock market.” Not at the floor. An untaxed, unspent, undivided index fund would have outgrown the cutoff by a wide margin. The list’s members as individuals face taxes, spending, giving and inheritance; the market’s total return does not. The list outpaced the household; it did not outpace the index.
“The cutoff tells you how rich the list is.” It tells you how rich the poorest member is. The median and the mean grew at different rates, and since 2017 the top has pulled away from the middle much faster than the floor has risen. One number can’t carry all of that.
“The line went up every year.” It fell in a third of the measurable years, and fell hard after 2000 and 2008. The floor is set by asset prices and moves with them.
“The data are clean.” A 44-year panel built from magazine lists has gaps (2018–2024), an unreliable early year (1983), years with more than 400 rows, and a 1982 starting point that Forbes itself has stated three different ways. The direction of the story is robust to all of it; the decimals are not.
Bottom line
In 1982, it took about $250 million in today’s money to be one of the 400 richest Americans. In 2025 it took $3.8 billion, and in 2026 Forbes put the line at $4.4 billion. After inflation, the price of admission rose about fifteen-fold — roughly five and a half times faster than the nominal economy, and far faster than the wealth of the typical family, whose median net worth rose only modestly over the same decades.
The rise came in bursts that track the stock market: the late 1990s, the mid-2000s, the 2010s, with sharp drops after the dot-com bust and the 2008 crash. And it was still slower than an index fund left alone, which is the clearest sign that the list is not a fixed club getting richer together. It is a moving bar, and most of the people who have cleared it at some point were eventually left behind by it.
The bottom of the list has kept its shape — the median member is still worth about twice the floor. The top has not: between 2017 and 2025 the mean pulled away from the median faster than in the previous 35 years combined. The price of admission tells you how hard it is to get in, not how far the people at the top have already gone.
Methods and sources. List data for 1982–2017 come from the Forbes 400 panel compiled by Enrico Moretti and Daniel J. Wilson for “Taxing Billionaires: Estate Taxes and the Geographical Location of the Ultra-Wealthy,” American Economic Journal: Economic Policy 15(2), 2023, distributed as openICPSR project 157481; 2025 figures come from Forbes’ published 2025 list. The 2018–2024 lists are not in the panel and nothing here is interpolated across them. The cutoff is the lowest net worth recorded in the panel for each year; the panel holds more than 400 rows in 1982–1984 and 1989–1994 and fewer than 400 in several years, notably 2007 (375) and 2012 (361), so in those years its floor is not necessarily Forbes’ 400th-place figure. The 1983 floor ($50 million against a Forbes-published $125 million) is excluded from comparisons as unreliable. Forbes’ own statements of the 1982 cutoff differ ($75 million in the panel and in Forbes’ 2012 list package; $91 million in a 2014 Forbes retrospective; $100 million in a 2021 Forbes piece), and the text gives the headline ratio under each. Real figures are in 2025 dollars using the BLS CPI-U, US city average, annual average, not seasonally adjusted (series CUUR0000SA0; 1982 = 96.5, 2025 = 321.943); the 2025 average is computed from eleven months because October 2025 CPI was not published. Ratios, growth rates, medians and means are this site’s calculations from the panel’s derived tables. GDP and population are BEA annual series via FRED (GDPA, GDPCA, B230RC0A052NBEA). Median family net worth for 1989 and 2016 is from the Federal Reserve’s SCF historical tables (Table 4, 2022 dollars); the 2022 figure is the Fed’s published $192,900 (the historical table rounds it to $192,700); the cutoff-to-median ratios are this site’s calculations. S&P 500 total returns are Damodaran’s annual series (current 2026 edition), compounded by calendar year; the Forbes list is compiled in late summer, so the windows are approximate. The 2026 cutoff, total and billionaire counts are Forbes’ own figures and are not part of the panel. All panel figures reflect the corrected build of 2026-10-01 (identity matching and value-extraction fixes). The panel double-counts part of the du Pont fortune in 1982–1984, so early-year totals are somewhat overstated. Source: Forbes 400, 1982–2017 and 2025.
A note on the 2025 list. Forbes has since restated its archived 2025 Forbes 400: 34 of its 400 names, all near the bottom of the list (mostly $3.8–4.9 billion), now differ from the version used here, a roster difference of about $64 billion, or under 1% of the total. The cutoff ($3.8 billion) and the top ($428 billion) are unchanged. We keep the list as Forbes first published it, the version behind its September 2025 “$6.6 trillion” headline, so that every post in this series and the interactive history rests on the same roster. Because the cutoff and the top are identical in both versions, the price-of-admission figures here are unaffected; the 2025 median moves by about $50 million (from $7.45 billion to $7.40 billion in the restated list).
Related reading: The Forbes 400: The 1982 List, 44 Years Later · The Forbes 400: Churn · Anatomy of the Forbes 400: Who’s Actually On the List · The Moving Target: Why $1 Million Doesn’t Mean What It Used To · Billionaire Rankings: How Extreme Wealth Is Counted · Forbes 400 history, 1982–2025 (interactive) · The 2025 Forbes 400 explorer